The Problem
Understanding the real daily cost gap between ICE and EV for Grab driver-partners. The market rate comparison is misleading -- Grab's existing fuel discounts change everything.
David Yuen | Associate, Rentals Partnership | Case Study | March 2026
EV full P&L at market rates = $135.24/day vs ICE full P&L = $122.41/day. Gap: $12.83/day. Existing EV discounts (15-20%) close only ~$6/day -- a utilisation-for-rates exchange is required.
4 CPOs (SP, Charge+, Shell, Strides) at $0.40 AC -- volume by driver geography, DC at market $0.73. CDG excluded (direct competitor). 4 leverage strategies beyond rate: first-mover, Grab's 187M downloads, CDG counter-position, off-peak incentive.
Understanding the real daily cost gap between ICE and EV for Grab driver-partners. The market rate comparison is misleading -- Grab's existing fuel discounts change everything.
At $3/L petrol, Grab's 29% Caltex discount brings ICE to $106.03/day -- the real benchmark EV must beat.
| Daily Cost Calculation | ICE | EV | |
|---|---|---|---|
| Rental | $80.00/day | $100.00/day | |
| Fuel / Charging cost | $36.67 (12.22L × $3.00) | $25.03 (34.84kWh×$0.68 + 1.83kWh×$0.73) | |
| Total (w/o discounts) | $116.67/day | $125.03/day | |
| Fuel Partner | Discount | Effective Petrol Price | ICE Daily Cost |
|---|---|---|---|
| No discount | 0% | $3.00/L | $116.67 |
| Shell (GrabFinance card) | 23.5% | $2.30/L | $108.05 |
| Caltex (GrabRentals drivers) | 29% | $2.13/L | $106.03 ← the real bar |
THE PROBLEM: Existing Grab EV discounts range 15-20% across CPOs -- but even the best-case scenario (Charge+ 18% off $0.63 = $0.52/kWh) gives EV $119.07/day, still $13.04+ above ICE Caltex ($106.03). SP's 20% off $0.70 = $0.56/kWh is worse. Closing the gap through charging discounts alone is insufficient. A fundamentally different approach is needed.
ICE fuel: 220km ÷ 18km/L = 12.22L/day → 12.22L × $3.00/L = $36.67/day. Sources: 220km, 18km/L, $3.00 (case annex).
ICE total (no disc.): $80 (rental) + $36.67 (fuel) = $116.67/day
ICE Caltex: $80 + 12.22L × $3.00 × (1−29%) = $80 + $26.03 = $106.03. Source: 29% (grabdriverbenefits).
ICE Shell: $80 + 12.22L × $3.00 × (1−23.5%) = $80 + $28.05 = $108.05. Source: 23.5% (GrabFinance).
EV energy: 220km ÷ 6km/kWh = 36.67kWh/day. 95% AC at $0.68 (HDB CPO median) + 5% DC at $0.73 = $25.03/day. Sources: HDB rate (MOT parliamentary reply), DC rate (LTA DataMall live API).
EV total (no disc.): $100 (rental) + $25.03 (charging) = $125.03/day
EV best-case disc: Charge+ 18% off $0.63 = $0.52/kWh → $100 + 36.67 × $0.52 = $119.07
SP 20% off $0.70 = $0.56/kWh → $100 + 36.67 × $0.56 = $120.54 (worse — higher base rate)
EV discounts: SP 20%, Charge+ 18%, Shell 18%, CDG 15%
Note: Caltex offers 29+2% with GRBeyond add-on ($5.09/day). Take-up data not public, but as a paid add-on, most cost-sensitive drivers likely use the base 29%. Even at 31%, ICE drops only $0.73/day — making EV more competitive, not less.
Sources: Caltex 29% (grab.com/sg/rentals). Shell 23.5% (GrabFinance). DC $0.73 = avg market rate (LTA DataMall API, March 2026). SP $0.70, Charge+ $0.63, Shell $0.68.
A utilisation-for-rates platform partnership: Grab's guaranteed fleet volume transforms CPO charger economics, in exchange for fleet AC rates that make EV the rational choice for drivers. DC stays at market -- the price gap is the behavioral incentive.
The deal: Grab guarantees 25.43 GWh/yr to AC CPOs -- overnight demand on chargers that currently sit idle. In return, CPOs give fleet AC rates at $0.40/kWh, preserving 27% gross margin.
Why CPOs accept: Guaranteed 3-year revenue, zero customer acquisition cost, zero credit risk. 90%+ HDB carparks have AC chargers -- fleet charges overnight while sleeping, zero friction.
Built-in behavioral incentive: DC stays at market ($0.73). Drivers save $0.33/kWh by choosing AC -- so they naturally charge 95%+ overnight. No enforcement needed.
For drivers: $10/day cheaper than market EV rental ($100)
For Grab: Helps meet Grab's 2,000 EV fleet ambition by Q4'28 — the rental reduction makes EV the rational choice for drivers, accelerating ICE-to-EV transition at scale
BOTTOM LINE: Only two levers needed. Including lower maintenance (+$6.40/day) and negligible net downtime (-$0.23/day: EV 2.2 min DC - ICE 1.4 min refuel), EV drivers take home +$6.93/day = +$208/month more. The AC/DC price gap ($0.40 vs $0.73) is itself the behavioral incentive -- drivers naturally charge AC overnight because it's 45% cheaper per kWh.
Start: $100 + 34.84×$0.68 + 1.83×$0.73 = $125.03. L1 (AC disc): 34.84×($0.68-$0.40) = -$9.76
L2 (Rental): $100→$90 = -$10.00 | Total = -$19.76. Result: $125.03-$19.76 = $105.27
Check: $90 + 34.84×$0.40 + 1.83×$0.73 = $90+$13.94+$1.34 = $105.27 ✓
Slide 4 showed the two levers that make EV cheaper. Here's what that means for a driver's daily earnings -- line by line, per ride.
| Per-Ride P&L (~20 rides/day) | ICE | EV | Diff. | Source |
|---|---|---|---|---|
| Net fare after commission | $8.00 | $8.00 | -- | $200/day ÷ 20, less 20% comm. (Grab Help Centre) |
| Less: Rental | -$4.00 | -$4.50 | -$0.50 | ICE $80 vs EV $90 (proposed) ÷ 20 |
| Less: Fuel / Charging | -$1.30 | -$0.76 | +$0.54 | Biggest saving -- 95/5 AC/DC blend ($0.40 AC, $0.73 DC market) |
| Less: Downtime | -$0.02 | -$0.03 | -$0.01 | ICE 1.4 min/day vs EV 2.2 min/day at $16.67/hr |
| Less: Maintenance | -$0.80 | -$0.48 | +$0.32 | 40% lower (DOE/Argonne 2021). No oil, regen braking |
| TAKE-HOME / RIDE | $1.88 | $2.23 | +$0.35 | +18.6% more per ride × 20 rides × 30 days |
KEY TAKEAWAY: EV drivers take home +$6.93/day more than ICE. The advantage comes from lower fuel cost (+$0.76/day ops), lower maintenance (+$6.40/day), minus negligible net downtime (-$0.23/day: EV 2.2 min - ICE 1.4 min). Over a year, that's +$2,529 more in a driver's pocket -- the single strongest adoption lever.
Rides/day: ~20 (conservative). Sources: Shout -- 21-27 rides at 10hrs. MustShareNews -- ~30 rides at 12hrs. Per ride = daily ÷ 20. Monthly = daily × 30.
ICE fuel: 220km ÷ 18km/L = 12.22L/day → ×$3.00×(1-29%) = $26.03 | EV: 34.84kWh×$0.40 + 1.83kWh×$0.73 = $15.27
Opp. cost: $200÷12hrs = $16.67/hr (Shout, HWZ). ICE downtime: 5min÷3.7days = 1.4min → $0.38 | EV: 2.2min → $0.61
Maint: ICE $480/mo, EV $288/mo (DOE/Argonne 2021). ICE: $200-$40-$80-$26.03-$0.38-$16 = $37.59 | EV: $200-$40-$90-$15.27-$0.61-$9.60 = $44.52
| AC / DC split | 0/100 | 50/50 | 70/30 | 80/20 | 95/5 ★ | 100/0 | Remarks | |
|---|---|---|---|---|---|---|---|---|
| Daily charge cost | $26.77 | $20.72 | $18.30 | $17.09 | $15.27 | $14.67 | Lower → cheaper | |
| EV total P&L | $138.59 | $126.43 | $121.57 | $119.13 | $115.48 | $114.27 | Green = beats ICE $122.41 | |
| DC charging time | 44 min | 22 min | 13 min | 9 min | 2.2 min (~2-3×/mo) | 0 min | At 50kW DC charger | |
| AC charging time | 0 hrs | 2.6 hrs | 3.7 hrs | 4.2 hrs | 5.0 hrs | 5.2 hrs | Overnight at 7kW HDB charger | |
| Verdict | Fails $16.18 above ICE |
Fails $4.02 above ICE |
Beats ICE $0.84 below ICE |
Beats ICE $3.28 below ICE |
Optimal ★ $6.93 below ICE |
Impractical $8.14 below ICE |
||
WHY 95/5: With full driver P&L (including maintenance & downtime), 70/30 and above all beat ICE. The $0.33/kWh price gap between AC ($0.40) and DC ($0.73) naturally drives drivers toward 95%+ AC overnight — no enforcement needed. 95/5 is the sweet spot: $6.93/day below ICE with DC flexibility for the rare midday top-up (~2-3 DC sessions/month).
Daily energy: 220km ÷ 6km/kWh = 36.67kWh/day (case annex). AC fleet rate: $0.40/kWh (41% off $0.68 market). DC: market $0.73/kWh (no discount). Charger speed: AC 7kW, DC 50kW.
At 95/5: AC = 36.67 × 95% = 34.84kWh × $0.40 = $13.94. DC = 36.67 × 5% = 1.83kWh × $0.73 = $1.34 → total $15.27. DC time = 1.83kWh ÷ 50kW × 60 = 2.2 min. AC time = 34.84 ÷ 7 = 5.0 hrs.
At 0/100 DC (full P&L): $90 + $26.77 charge + $12.22 downtime (44 min × $16.67/hr) + $9.60 maint = $138.59 (fails vs ICE $122.41).
At 100/0 AC (full P&L): $90 + $14.67 charge + $0 downtime (AC overnight) + $9.60 maint = $114.27 (best cost, but impractical -- no DC fallback). 90%+ HDB carparks have chargers (LTA Dec 2025).
Battery: BYD Atto 3 ~60kWh (Grab-BYD 50K EV deal, Jan 2025). Consumption: 3.06 kWh/hr → full battery lasts 19.6 hours (well beyond 12-hr shift). After 12 hrs: 39% SOC remaining (23.3 kWh). Full overnight recharge: 5.2 hrs at 7kW.
Each cell shows EV full daily P&L cost (rental + charging + downtime + maintenance) at a given rental (rows) × AC charging rate (columns). 95/5 AC/DC blend; DC fixed at market $0.73/kWh.
Beats ICE ($122.41) | Loses to ICE | ★ = recommendation
| Rental\AC Rate | $0.40 | $0.42 | $0.44 | $0.46 | $0.48 | $0.50 | $0.55 | $0.60 |
|---|---|---|---|---|---|---|---|---|
| $85 | $110.48 | $111.18 | $111.87 | $112.57 | $113.27 | $113.96 | $115.71 | $117.45 |
| $88 | $113.48 | $114.18 | $114.87 | $115.57 | $116.27 | $116.96 | $118.71 | $120.45 |
| $90 | $115.48 ★ | $116.18 | $116.87 | $117.57 | $118.27 | $118.96 | $120.71 | $122.45 |
| $92 | $117.48 | $118.18 | $118.87 | $119.57 | $120.27 | $120.96 | $122.71 | $124.45 |
| $95 | $120.48 | $121.18 | $121.87 | $122.57 | $123.27 | $123.96 | $125.71 | $127.45 |
| $100 | $125.48 | $126.18 | $126.87 | $127.57 | $128.27 | $128.96 | $130.71 | $132.45 |
| $105 | $130.48 | $131.18 | $131.87 | $132.57 | $133.27 | $133.96 | $135.71 | $137.45 |
| ICE Total | $122.41 | $122.41 | $122.41 | $122.41 | $122.41 | $122.41 | $122.41 | $122.41 |
MARGIN OF SAFETY: Our recommendation ($90 rental, $0.40 AC, $0.73 DC market) sits at $115.48 — $6.93 below ICE. The breakeven AC rate at $90 rental is $0.60/kWh — our $0.40 target has headroom. The rental lever is the strongest safety net: at $88, EV = $113.48 even at $0.40 AC. At $85, EV = $110.48. The $85–$88 rental band provides full margin of safety. Only AC needs negotiation — DC stays at market.
Formula: EV daily P&L = Rental + (34.84kWh × AC rate) + (1.83kWh × $0.73) + $0.61 downtime + $9.60 maintenance. ICE benchmark: $122.41 (Rental + Fuel + Downtime + Maintenance).
Recommended cell: $90 + $13.94 + $1.34 + $0.61 + $9.60 = $115.48 ★. AC breakeven at $90: ($122.41 − $90 − $1.34 − $0.61 − $9.60) ÷ 34.84 = $0.60. Best case: $85 + $13.94 + $1.34 + $0.61 + $9.60 = $110.48.
Since 95% of fleet charging is overnight AC at home, CPO selection is based on residential coverage. 74.8% of Singapore's 2,755 charger locations are residential (OneMap + data.gov.sg verified).
| # | CPO | Res. Locations | % of SG Residential | Incremental | Cumulative | Current Rate | Phase |
|---|---|---|---|---|---|---|---|
| 1 | SP Mobility | 420 | 20.5% | 420 | 21.7% | $0.70 | Phase 1 |
| 2 | Charge+ | 344 | 16.6% | +343 | 39.4% | $0.63 | Phase 1 |
| 3 | Shell | 365 | 17.7% | +352 | 57.6% | $0.68 | Phase 2 |
| 4 | Strides | 305 | 15.0% | +291 | 72.7% | $0.65 | Phase 2 |
| -- | Excluded |
| Region | SP Mobility | Charge+ | Shell | Strides |
|---|---|---|---|---|
| East | 772★ | 85 | 162 | 412 |
| Central | 468 | 734★ | 69 | 253 |
| West | 70 | 537★ | 26 | 2 |
| North | 459 | 251 | 523★ | 52 |
| NE | 198 | 150 | 325★ | 27 |
RECOMMENDATION: 4 CPOs × $0.40/kWh AC. No volume split -- geography-based. Sequential: SP (anchor) → Charge+ → Shell → Strides. 72.7% residential coverage. DC at market $0.73.
Residential: OneMap API + data.gov.sg HDB streets → 2,060/2,755 = 74.8%. Estates: SP 420 (21.7%) → +Charge+ 763 (39.4%) → +Shell 1,115 (57.6%) → +Strides 1,406 (72.7%). CDG excl: +458 → 96.3%.
Driver impact: covered +$6.93/day, uncovered +$0.08/day, gap $205/mo. Fleet avg at 4 CPOs: 72.7%×$6.93 + 27.3%×$0.08 = +$5.06/day. Sources: LTA DataMall, OneMap API, data.gov.sg, CDG corporate.
| Term | Detail | Rationale |
|---|---|---|
| Rate | AC $0.40/kWh (41% off $0.68). DC at market. | 27% gross margin preserved. 3-year guaranteed volume. |
| Duration | 3-year initial, annual renewal | CPO investment horizon; renegotiation flexibility. |
| Min. commit | 80% of allocated volume | Bankable revenue certainty for capacity planning. |
| MFN clause | Auto-match any lower competitor rate | Standard fleet procurement protection. |
| Volume | No pre-set split. Geography-based. QBR reallocation. | Drivers charge at home -- CPO share = where drivers live. |
| Escalation | 2,000 EVs (by Q4'28) | Grab's public commitment. Revenue grows with fleet. |
| Metric | Without Grab | With Grab |
|---|---|---|
| Revenue certainty | Walk-in, variable | ~$0.69M/yr per CPO (AC margin) |
| Total partner CPOs gross profit | Uncertain | $2.77M/yr (all 4) |
| Charger utilisation | 60-70% of charger points idle (LTA API, Jan 2026) | ~19% incremental utilisation |
| Precedent | CDG pays $0.40 for own fleet (Greenlots) | |
| CPO | Public | Discount | Coverage | Gross Margin/yr |
|---|---|---|---|---|
| SP | $0.70 | 20% → 43% | 21.7% | $0.83M |
| Charge+ | $0.63 | 18% → 37% | 17.7% | $0.67M |
| Shell | $0.68 | 18% → 41% | 18.2% | $0.69M |
| Strides | $0.65 | 15% → 38% | 15.1% | $0.58M |
| Others | $0.68 | 0% | 27.3% | — |
| Total | $0.68 | → 41% | 100% | $2.77M |
THE PITCH: "At $0.40 you keep 27% gross margin -- healthy and guaranteed. We bring 26.8 GWh/yr of overnight demand on chargers that currently earn nothing. One contract replaces thousands of walk-in sign-ups. Zero marketing cost, zero credit risk, guaranteed settlement. And as our fleet grows to 2,000 EVs (by Q4'28), your revenue grows with us."
Revenue: 25.43 GWh × $0.40 = $10.17M AC + 1.34 GWh × $0.73 = $0.98M DC. Fleet margin: ($0.40-$0.2911)/$0.40 = 27.2%. Gross profit: 25.43 GWh × $0.1089 = $2.77M/yr. Petrol ~0%: station cost ~$2.76/L, after 29% disc = $2.13/L → -30% margin. EV 27%: $0.40 - $0.2911 = $0.109/kWh margin. Sources: EMA $0.2911 (spgroup.com.sg), AC $0.68 (LTA DataMall), CDG $0.40 (Greenlots), Caltex 29% (grab.com/sg/rentals), Shell/BP annual reports.
| Scenario | 2,000 EVs by | Timeline | CAGR | Benchmark |
|---|---|---|---|---|
| Optimistic | Q3'27 | 6 months | N/M† | Grab's own: 11K+ in Indonesia, 10K+ in Thailand |
| Base | Q1'29 | 2 years | 216% | SG EV market CAGR 103% + financial incentive uplift |
| Conservative | Q2'30 | 3.25 years | 103% | Strides 300 in 5mo, CDG 400→1K in 2yrs |
| AC (95%) | 25.43 GWh × $0.40 = $10.17M |
| DC (5%) | 1.34 GWh × $0.73 = $0.98M |
| Total | $11.15M ($0.4165 blended) |
| CPO gross profit | 25.43 GWh × $0.109 = $2.77M/yr |
Consumption: 220km, 6km/kWh, 2,000 EVs (case annex). 36.67×2,000×365 = 26.8 GWh. Market size est: 10,876 chargers × 7kW avg × 24hrs × 20% util × 365 × $0.68 = ~$80M (computed from LTA data).
At 2,000 EVs: 25.43 GWh × $0.40 + 1.34 GWh × $0.73 = $11.15M/yr. Ramp: Conservative CAGR ~100% (SG EV market, LTA 2020-25: 1,397→49,110 = 103% CAGR). Base ~215% (2× market, justified by +$208/mo driver incentive). Optimistic 330/mo (Grab deployed 11,000+ EVs in Indonesia, 10,000+ in Thailand). CPO margin: ($0.40-$0.2911) = $0.109/kWh × 25.43 GWh = $2.77M (EMA tariff, spgroup.com.sg).
CDG is vertically integrated: owns CPO (CDG ENGIE, 2,054 chargers) + operates 8,400+ taxis at $0.40/kWh. Independent CPOs face market bifurcation -- CDG controls its own charging destiny. Partnering with Grab is the independent CPO's best counter-position. Source: CDG corporate, LTA DataMall.
Partner CPO charger locations promoted within the Grab app to non-fleet users. Free marketing channel to millions of Grab consumers who own personal EVs -- driving walk-in traffic to partner chargers beyond the fleet. Source: Grab corporate (187M+ app downloads across SEA).
Grab is Singapore's first large-scale fleet electrification effort. The CPO that partners with Grab gets a reference customer for every future fleet contract -- TADA (1,200 EVs by 2027), Ryde (600-1,200 EVs), logistics/delivery fleets. Being "Grab's official charging partner" is a credential that wins future business. Source: Ryde NASDAQ filing (Dec 2024), TADA/EVFY partnership.
95% of fleet charges overnight. USEP wholesale averages $0.105-0.123/kWh (2024), vs regulated tariff $0.2911. Off-peak is typically 30-40% lower than peak. CPOs on contestable supply benefit from lower overnight procurement cost -- shared savings, not a concession. Source: EMC Singapore, EMA spgroup.com.sg.
KEY INSIGHT: These strategies work because they address what CPOs actually need -- not just volume, but demand predictability, operational simplicity (one contract vs thousands), and a defensible market position against CDG's vertical integration. Each strategy is independently valuable; together they make the $0.40 rate a rational business decision, not a concession.
Sources: CDG $0.40 fleet rate (Greenlots/CDG Taxi). Charger idle rate: 49% of residential locations fully available (LTA DataMall live API, Mar 2026 scan, 2,738 locations). EVgo 19% utilisation (Q1 2024 10-K, investors.evgo.com). Volume: 2,000×36.67×365 = 26.8 GWh (case annex). Market size: ~133 GWh (10,876 chargers × 7kW × 24h × 20% × 365, LTA data). CDG: 8,400+ taxis, 2,054 chargers (CDG corporate). USEP: $105-123/MWh avg 2024 (EMC Singapore, emcsg.com). EMA tariff: $0.2911/kWh (spgroup.com.sg Q1 2026).
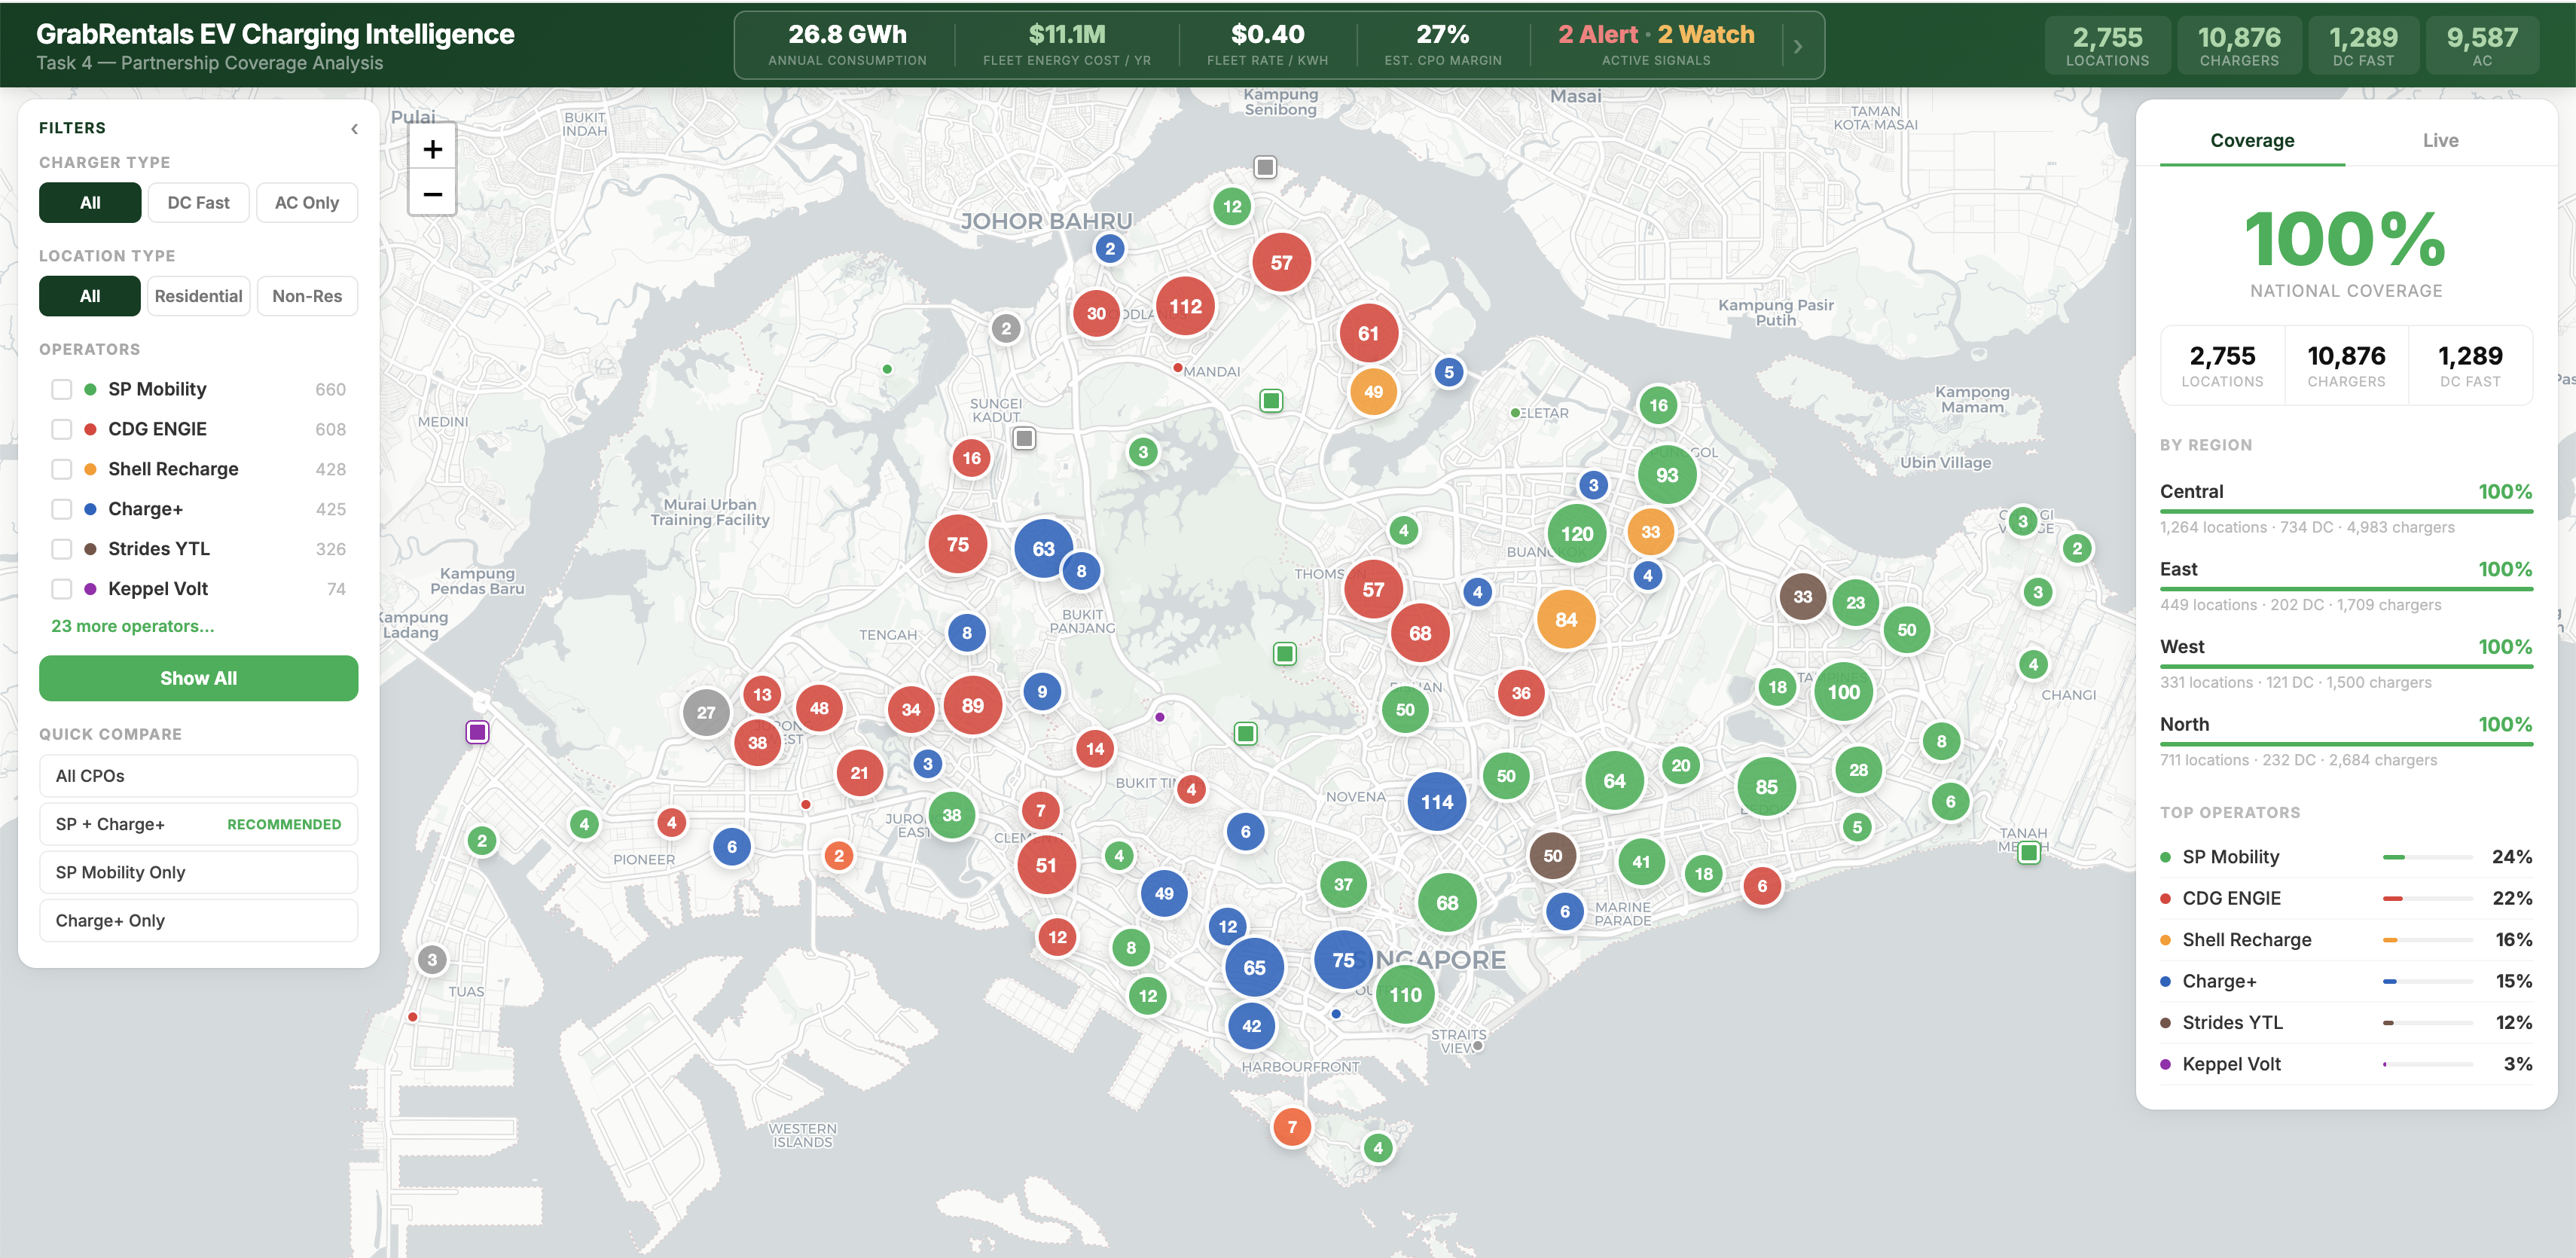
This is a live interactive dashboard I built for the GrabRentals case study -- it maps all 2,755 EV charging locations across Singapore, colour-coded by operator, with real-time filters for charger type and location.
The header shows our fleet's key commercial metrics at a glance: 26.8 GWh annual consumption, $11.2M fleet cost, and critically, 2 active alerts. Clicking those KPIs opens 12-month trend charts.
The Commercial Intel button opens a full CPO scorecard -- four signals per partner with specific recommended actions -- so for example, SP Mobility's utilisation hitting 87% and rising three consecutive weeks would immediately trigger a volume reroute to Charge+ and a cap clause at the next QBR.
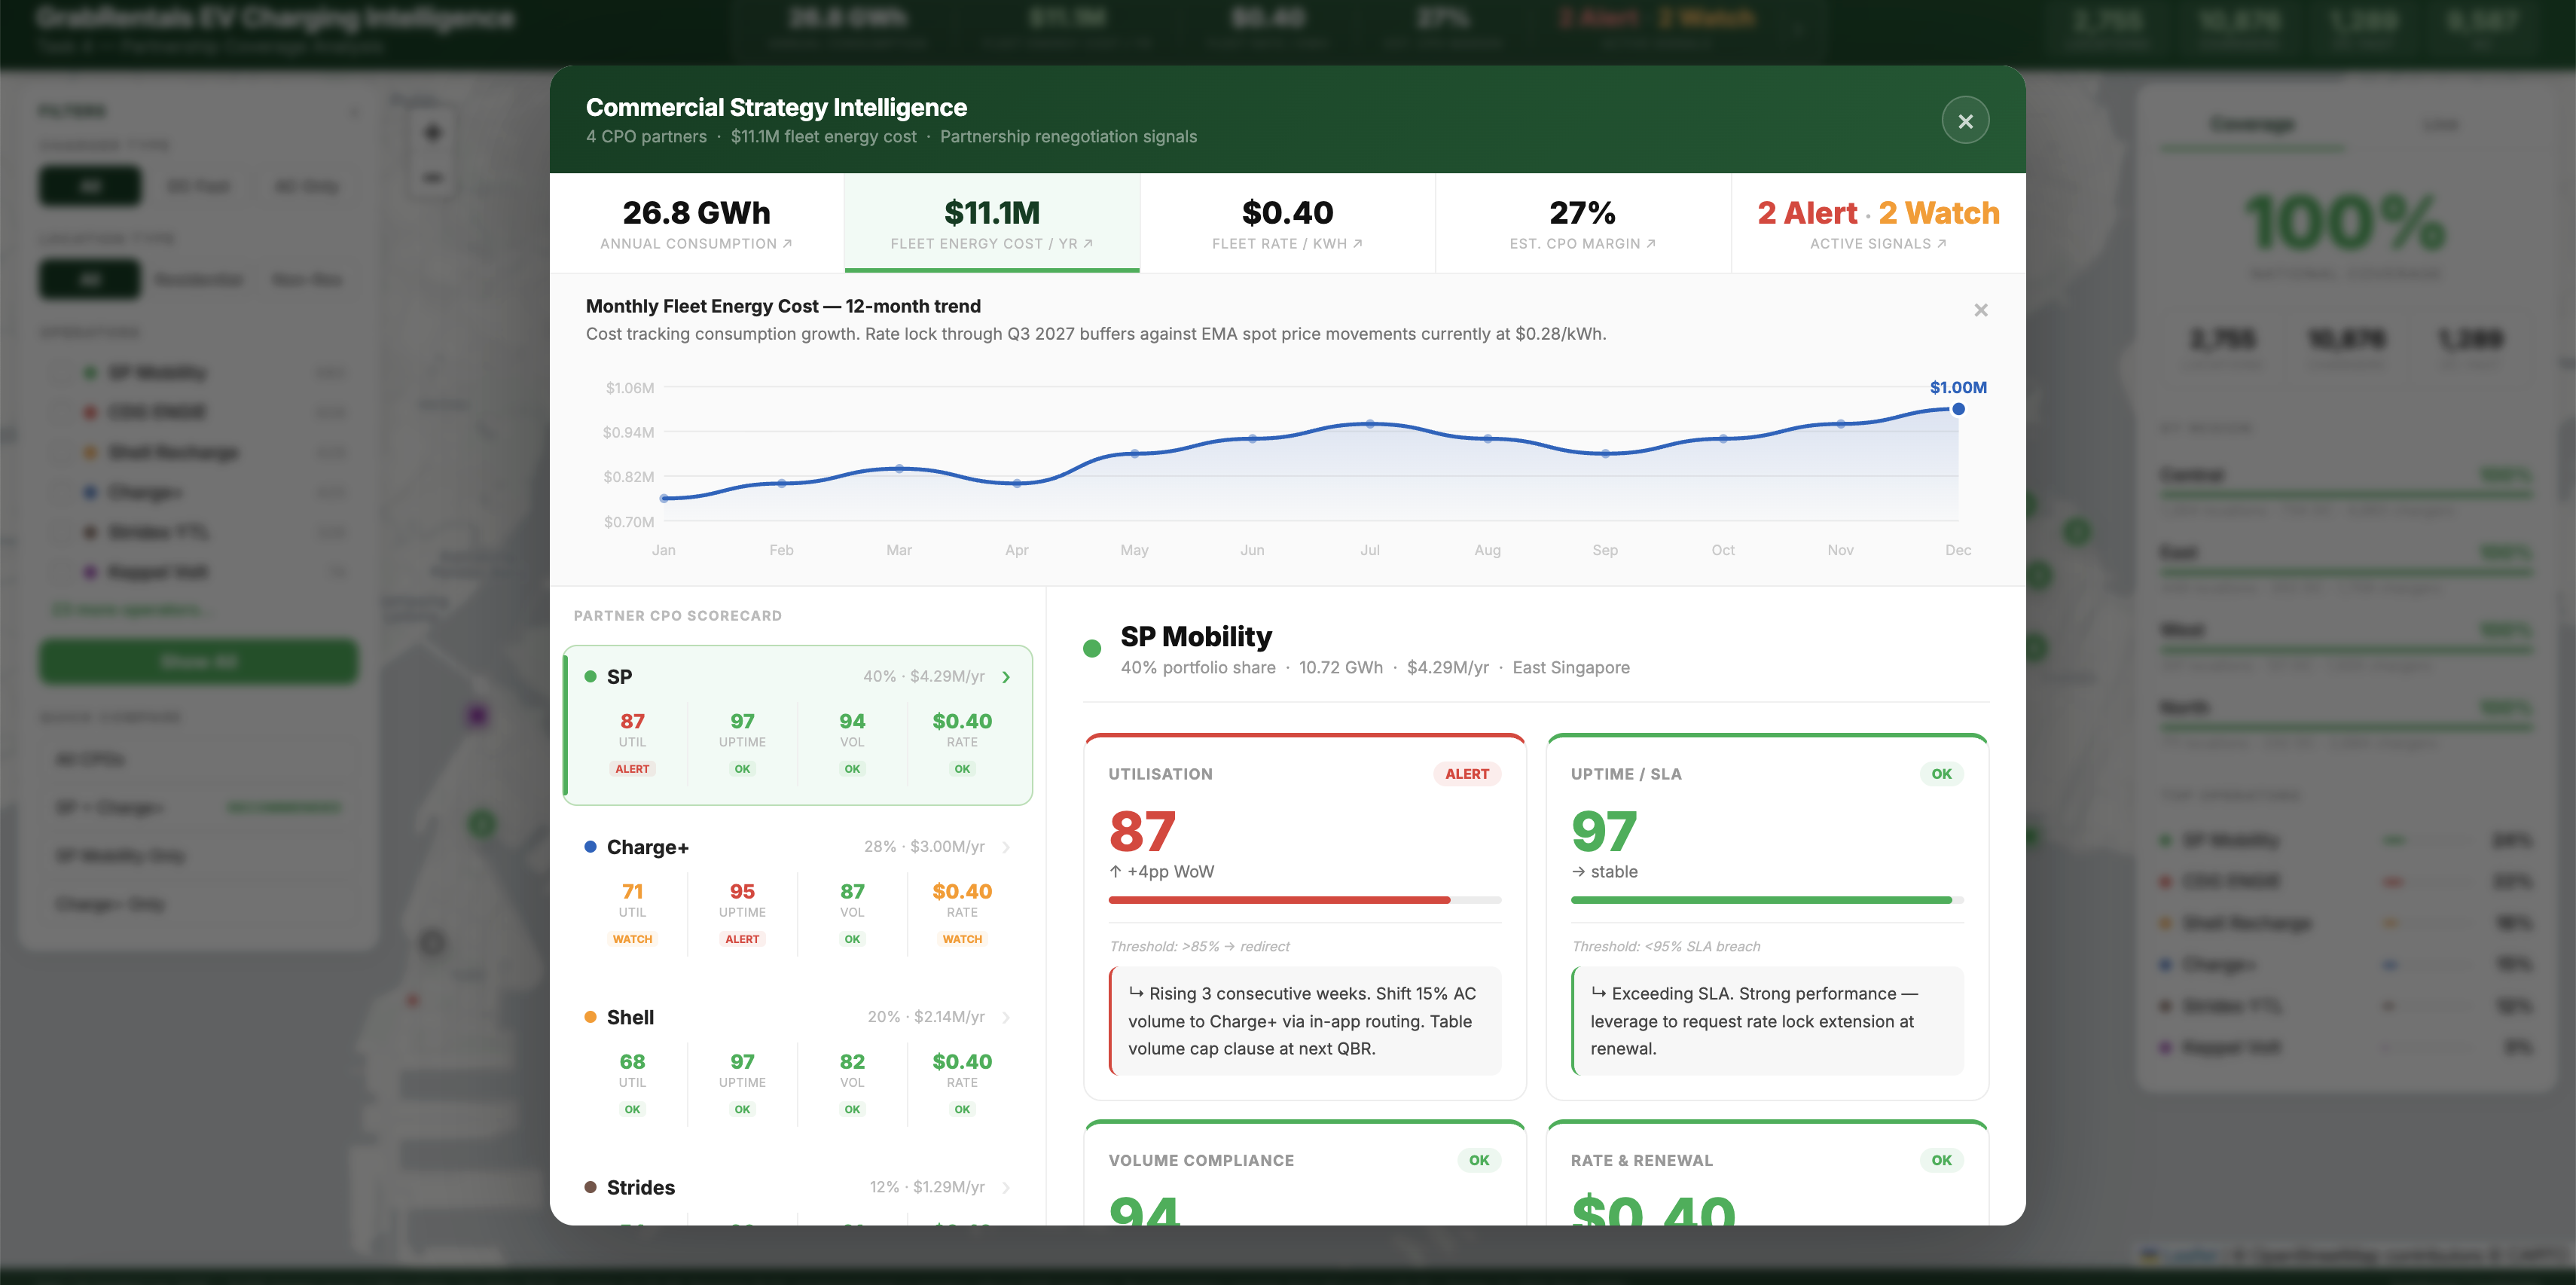
Trend: SP Mobility AC charger utilisation rises above 85% for two consecutive weeks (dashboard shows 87%, flagged ALERT). Tactical shift: Grab immediately redirects 15% of SP's overnight AC volume to Charge+ via in-app routing -- no renegotiation, no confrontation. At the next QBR, Grab presents the utilisation data and negotiates: either SP widens the fleet-vs-public rate differential (high utilisation proves public demand supports a higher public rate -- Grab's off-peak fleet volume is now more valuable), commits to bidding on upcoming HDB charger tenders to expand AC capacity, or Grab permanently reallocates that volume share to Charge+. Why this works: The 4-CPO structure makes the threat credible -- SP knows Charge+ absorbs the diverted volume overnight. Dashboard data gives Grab objective evidence for renegotiation rather than a subjective complaint.
Each variable stressed independently while others held at base case. Base advantage = +$6.93/day. DC at market is already priced in.
Method: each variable stressed independently while others held at base case. Base advantage = +$6.93/day.
EV cost = Rental + 34.84kWh × AC rate + 1.83kWh × $0.73 + downtime + maintenance.
ICE cost = $80 + 12.22L × petrol × (1-discount) + downtime + maintenance. Swing = |upside - downside|.
| Alternative | Why It Fails |
|---|---|
| Don't touch rental -- just negotiate charging discounts | At $100 rental, EV full P&L = $125.48/day vs ICE $122.41. Charging discounts alone leave a $3.07/day gap. Even free charging ($0/kWh) only brings EV to $110.21 -- rental reduction is essential to maximise driver advantage. |
| Subsidise drivers directly ($5/day charging credit) | Band-aid, not infrastructure. Costs $3.65M/year with zero structural improvement. Doesn't scale -- doubles if fleet doubles. Partnership creates a permanent rate advantage that scales with volume. |
| Build own charging network (like CDG/ENGIE) | Capital intensive ($50-100K per charger), takes 2-3 years, not Grab's DNA. CDG did this because they're a transport infrastructure conglomerate. Grab is a tech platform -- partner, don't build. |
| Partner with one CPO for maximum volume leverage | Single point of failure -- network outage, bankruptcy, or relationship breakdown leaves fleet stranded. No competitive tension means no pressure to maintain quality or improve rates. |
| Assume drivers charge at home ($0.29/kWh residential tariff) | Factually wrong. HDB residents charge at CPO rates ($0.58-0.68/kWh), not EMA residential tariff. Only landed property owners get $0.29/kWh. Building strategy on false assumption would collapse at implementation. |
| Wait for EV economics to improve naturally | CPO rates are rising (SP may now be $0.77-0.83 DC). CDG is moving now. TADA has 1,200 EVs. First-mover locks in preferential CPO terms and builds switching costs (app integration, data partnerships). |
BOTTOM LINE: Every alternative either fails the math (can't close the cost gap), fails the economics (unsustainable burn), or fails strategically (doesn't build a defensible position). The utilisation-for-rates partnership is the only approach that creates new value for both sides while scaling with fleet growth.
Charging discounts only (full P&L): with $100 rental + $0.40 AC fleet rate, EV = $100 + $15.27 + $0.61 + $9.60 = $125.48 -- $3.07 above ICE ($122.41). Rental reduction is essential to maximise driver advantage. At $90 rental: EV = $90 + $15.27 + $0.61 + $9.60 = $115.48 -- $6.93 below ICE.
Direct subsidy cost: 2,000 EVs × $5/day × 365 = $3.65M/yr; doubles to $7.3M at 4,000 EVs. Zero structural rate improvement. Source: internal modelling.
Build own network: $50-100K per charger installed (industry benchmark; includes hardware, civil works, grid connection). CDG built 2,054 chargers -- at this scale, capex = $103M-$205M; 2-3 year build timeline. Grab's 2,000-EV fleet would need ~500 dedicated AC charger points (4 EVs per point, overnight): 500 × $50-100K = $25M-$50M capex, plus ongoing site leases, operations, and staffing. Source: CDG corporate; charger cost benchmarks per BloombergNEF 2024.
Residential tariff: EMA regulated rate $0.2911/kWh applies to private landed homes only. HDB residents charge at CPO public rates -- median $0.68/kWh AC (LTA DataMall, March 2026). Source: EMA spgroup.com.sg.
CPO rates rising: DC market rate was $0.73/kWh at time of analysis (LTA DataMall API, March 2026); SP Group DC rate estimated at $0.77-0.83/kWh based on scan of SP charger listings (unconfirmed; treat as indicative). First-mover rate lock protects against further increases. TADA 1,200 EVs (TADA/EVFY partnership press release). CDG 400→1,000 EVs (CDG corporate).
| Category | Data Points |
|---|---|
| Case Annex | ICE $80, Petrol $3/L, 18 km/L, EV $100, 6 km/kWh, 220 km, 2,000 EVs |
| CPO Rates | SP $0.70 (LTA API live) | Charge+ $0.63 (LTA API live) | Shell $0.68 (LTA API live) | CDG $0.68 (LTA API live) | Keppel $0.49 (LTA API live) |
| Grab Fuel | Caltex 29% (grab.com/sg/rentals) | Shell 23.5% (GrabFinance) |
| Grab EV Disc. | SP 20%, Charge+ 18%, Shell 18%, CDG 15% (grab.com/sg/grabdriverbenefits) |
| Electricity | $0.2911/kWh incl. 9% GST -- EMA Q1 2026 (spgroup.com.sg) |
| Driver Earnings | ~$200/day gross (Mothership, DareToFinance, Confessions of a Grab Driver). ~12hr shifts typical (Shout, HardwareZone) → $16.67/hr opp. cost. ~20 rides/day (Shout: 21-27 at 10hrs, MustShareNews: ~30 at 12hrs -- 20 used as conservative estimate) |
| ICE Fueling Time | ~5 min per fill, 45L tank ÷ 12.22L/day = fill every 3.7 days → 1.4 min/day amortised → $0.38/day at $16.67/hr. Assumption: 45L tank (typical sedan) |
| Regulatory | 60K chargers by 2030 (LTA) | EV taxi 10yr (LTA) | EEAI expires Jan 2027 |
| Competition | CDG 8,400+ taxis | Gojek 10% | TADA flat $0.50-0.80 | Ryde 1,200 EVs (NASDAQ) |
| Maintenance | BEV 6.1¢/mile vs ICE 10.1¢/mile = 40% saving. Source: US DOE/Argonne National Lab, Burnham et al. (2021) "Comprehensive Total Cost of Ownership Quantification for Vehicles with Different Size Classes and Powertrains" (energy.gov/eere). SG figures: ~$480/mo ICE, ~$288/mo EV -- scaled for SG labour/parts costs + PHV mileage (220km/day vs ~50km/day personal car). |
| Partnerships | Grab-BYD 50K EVs (Jan 2025) | Grab-GAC 20K EVs (Jan 2026) | 50% EV by 2030 |
| CPO Margins | AC public margin: ($0.68 - $0.2911) ÷ $0.68 = 57.2%. Fleet margin: ($0.40 - $0.2911) ÷ $0.40 = 27.2%. Margin/kWh: $0.1089. Total fleet AC: 25.43 GWh × $0.1089 = $2.77M/yr gross profit across 4 CPOs. Per-CPO share determined by driver geography. Inputs: EMA tariff $0.2911 (spgroup.com.sg), AC market $0.68 (LTA DataMall HDB median). |
| Petrol Margins | Industry gross margin 5-8% (industry standard, Shell/BP annual reports). Caltex 29% discount nearly eliminates margin. CDG fleet rate $0.40/kWh (Greenlots/CDG Taxi internal rate). |
| Battery | BYD Atto 3: ~60kWh battery. 36.67 kWh/day consumption → 39% SOC remaining after 12-hr shift. 3.06 kWh/hr → 19.6 hrs to depletion. Full recharge: 5.2 hrs at 7kW AC. |